← ALL WORKPROJECT / 05

FINTECH / TRADING JOURNAL / WEB & MOBILE

SETUPBOOK.

A trading journal for traders who log their trades by hand: enter a trade in 30 seconds and see win rate, profit factor, expectancy, drawdown and the cost of every mistake, computed from what you actually did. Live on the web at setupbook.io, mobile apps coming soon.
OPEN SETUPBOOK.IO
COMING SOON ONAPP STORECOMING SOON ONGOOGLE PLAY
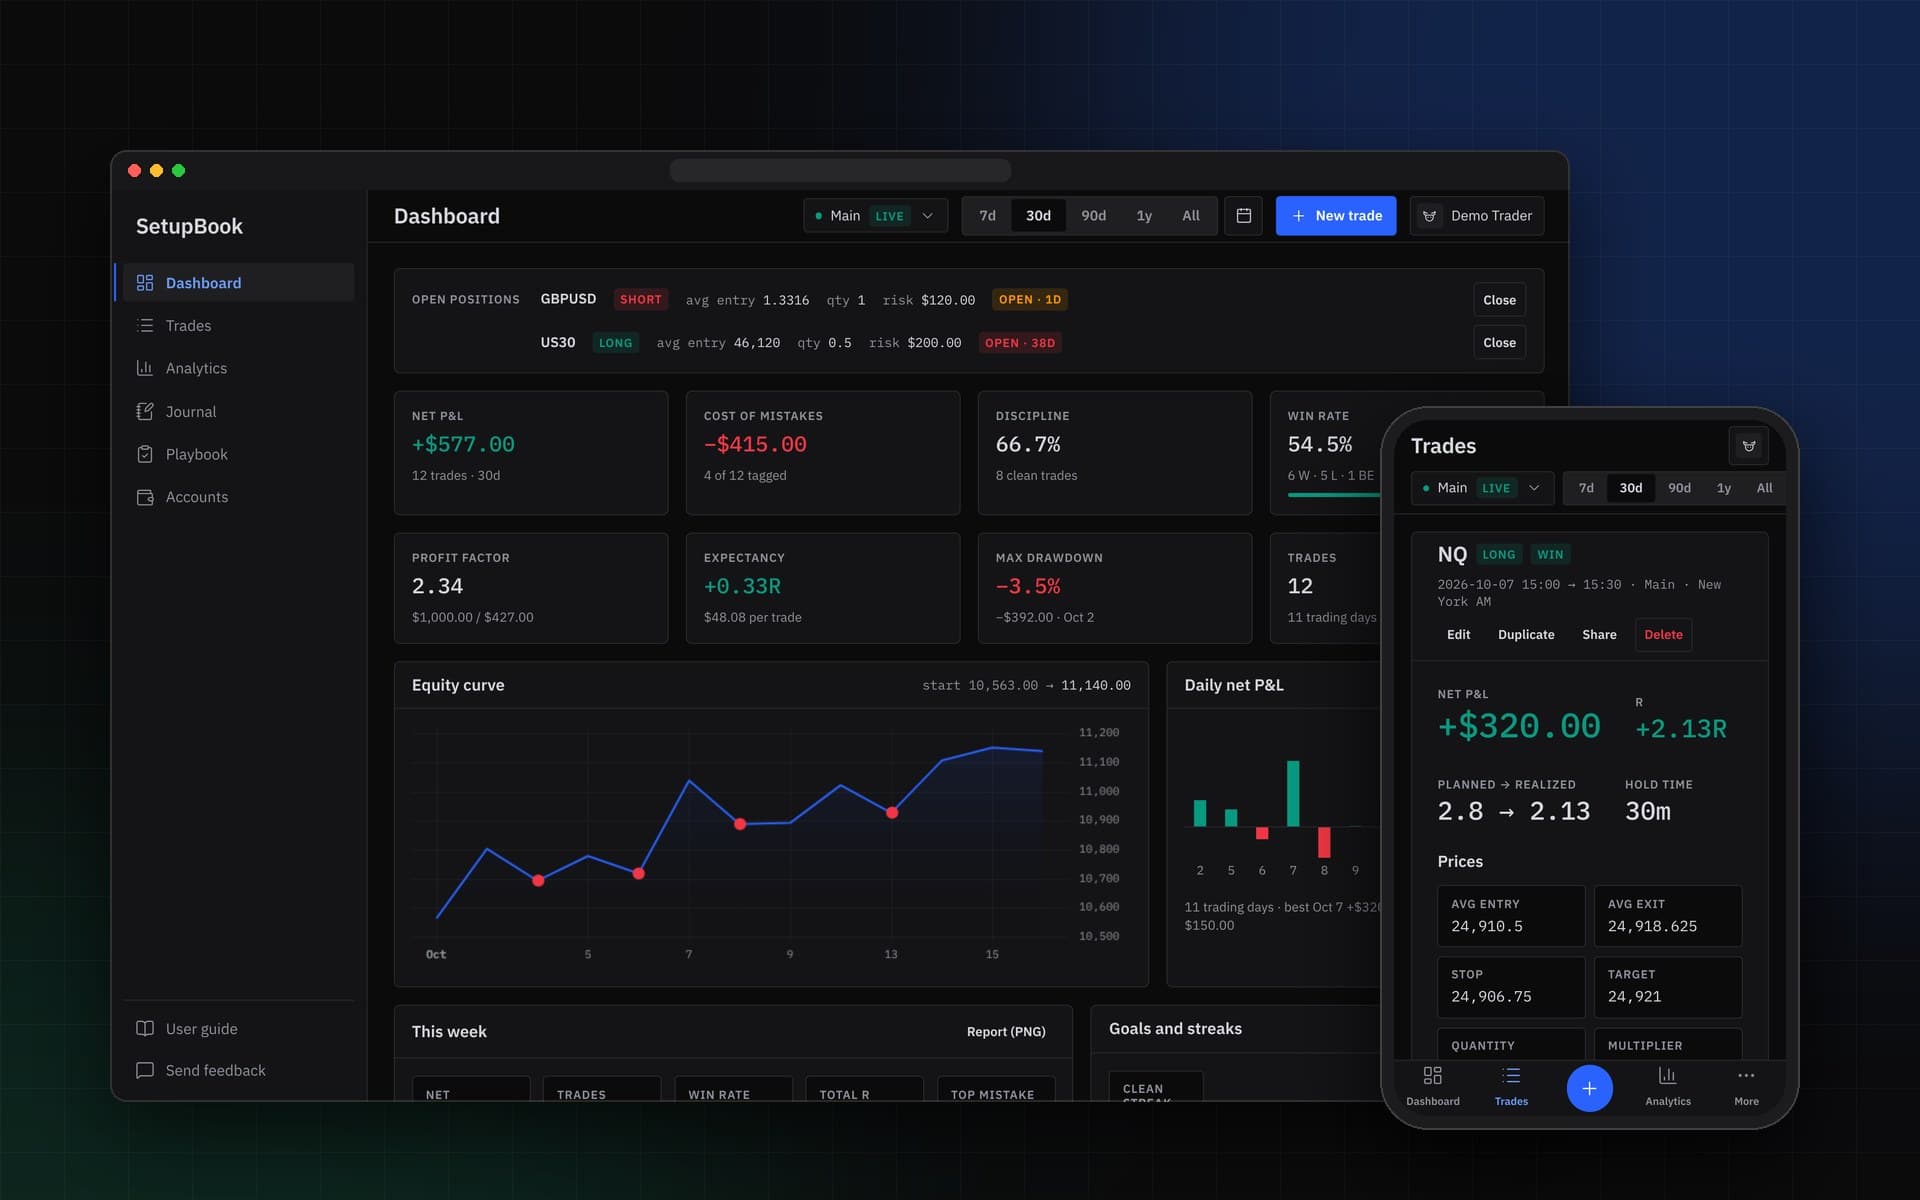
The SetupBook dashboard from the demo account beside a trade detail on a phone
Year
2026
Platforms
Web; iOS and Android coming soon
Stack
Next.js, TypeScript, Firebase
Our role
Design, development, data
Status
Web live, mobile apps coming soon

THE PROBLEM

THE MATH
NOBODY DOES.

Most trading journals are a spreadsheet that stops being filled in by the third week, or a tool that shows a win rate without saying how it got there. The numbers that change how someone trades, such as what breaking a rule cost, whether the A setups really pay and how close a prop account is to its drawdown limit, are the ones a spreadsheet never works out.

THE BUILD

ONE FORMULA,
EVERY SCREEN.

Next.js 16 with TypeScript, Tailwind and shadcn/ui on Firebase Auth, Firestore and Storage, in English and Turkish, in dark and light themes. Every number in the product comes from one module of pure functions, tested against a verification table worked out by hand: P&L from fills, partial exits and scale-ins, R from the planned stop, win rate, profit factor, expectancy, drawdown, consistency and a trader score whose formula is shown on the screen. A four-step trade form computes P&L, risk and R while you type, a pre-trade checklist and mistake tags turn discipline into a number, and trades can be imported from MT4 and MT5 reports, Binance, TradingView or any CSV through column mapping. Firestore security rules keep each user's data readable only by that user, and the rules are tested in the emulator.

WHAT SHIPPED

LOGGED IN
30 SECONDS.

SetupBook is live at setupbook.io: a dashboard, a trades table and P&L calendar, analytics broken down by symbol, strategy and session, a journal with day notes, mood and week reviews, a playbook of strategies with their own stats, prop-firm limits, public share cards and a bilingual blog and user guide. The screens on this page come from the demo account. Native apps for iOS and Android are coming soon.
06
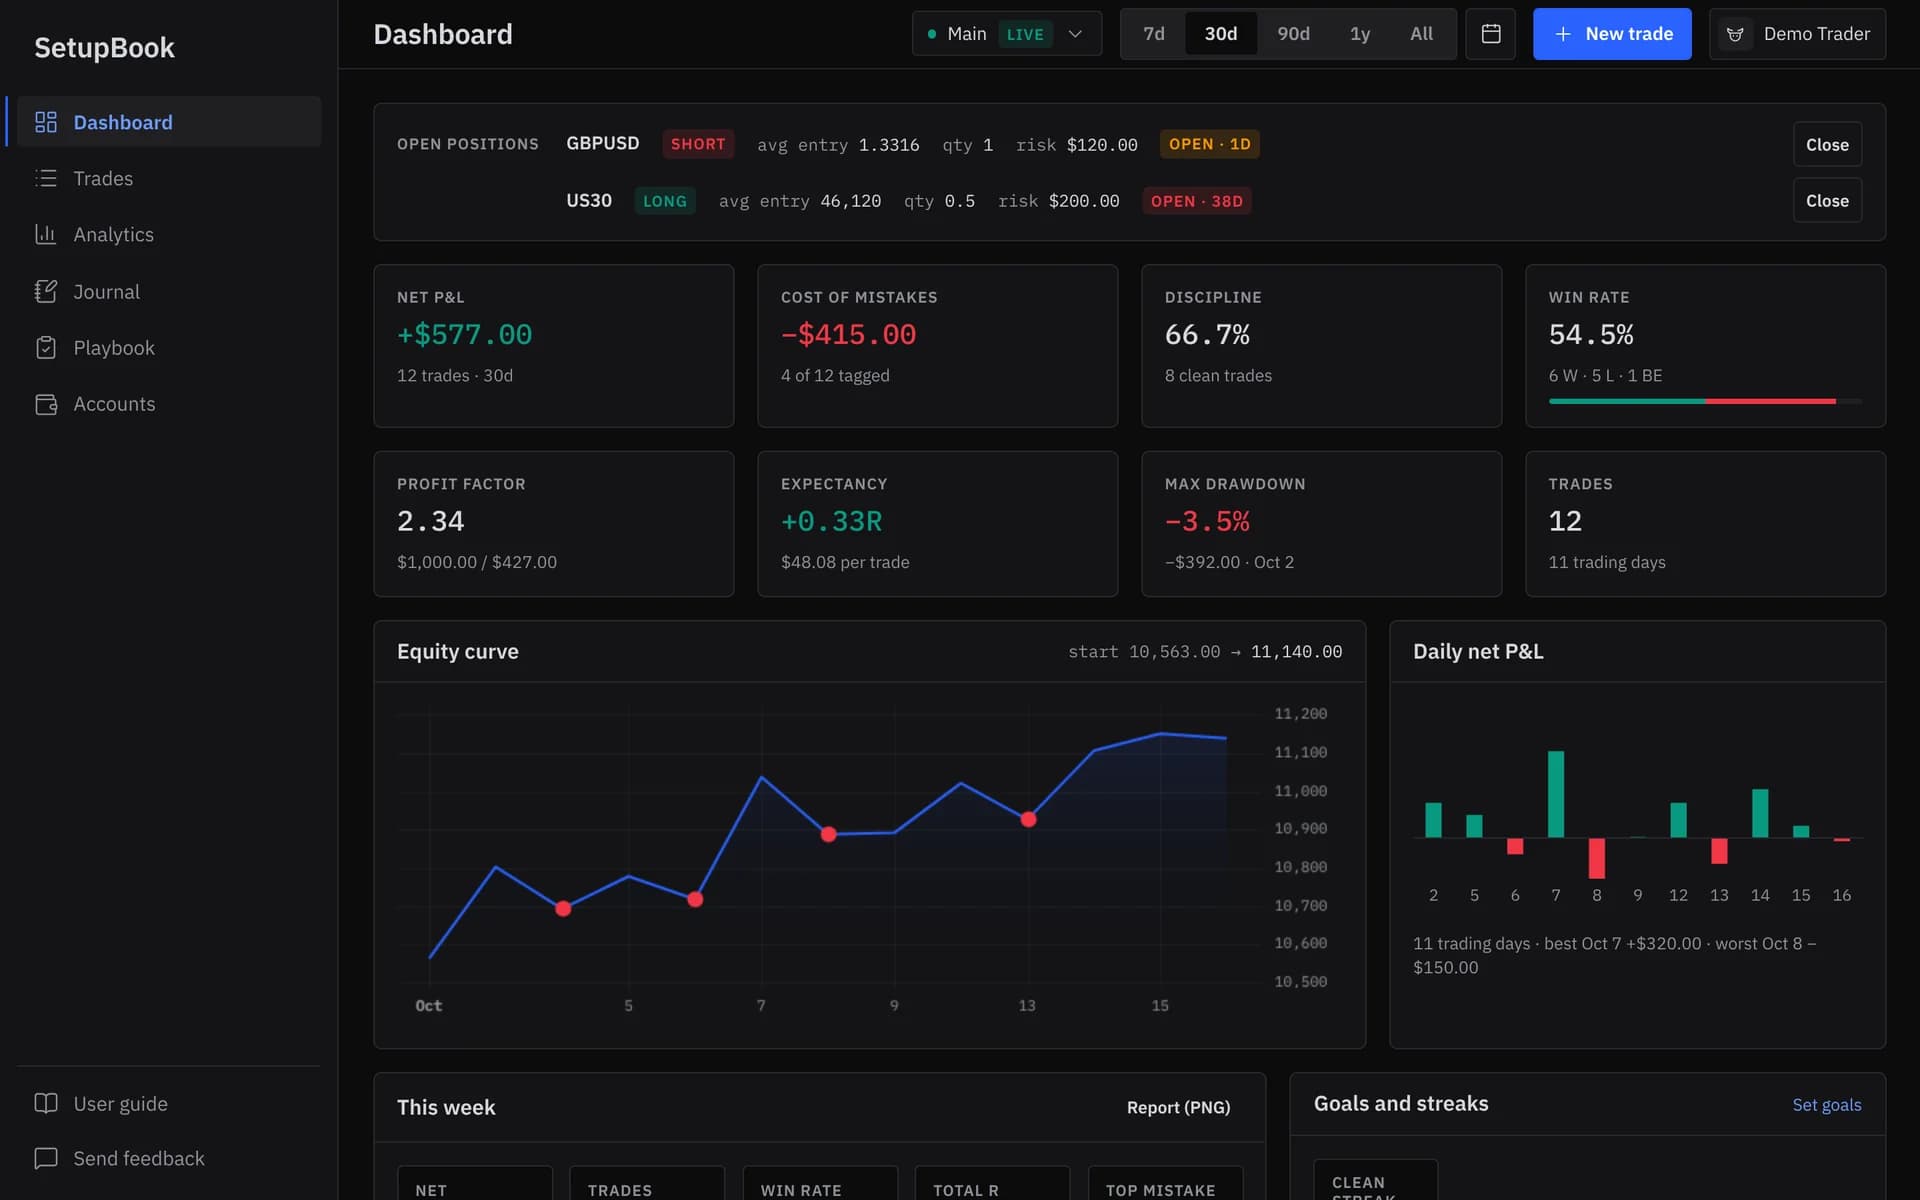
  • The dashboard: open positions, eight KPI cards from net P&L and cost of mistakes to max drawdown, the equity curve and the daily net P&L chart
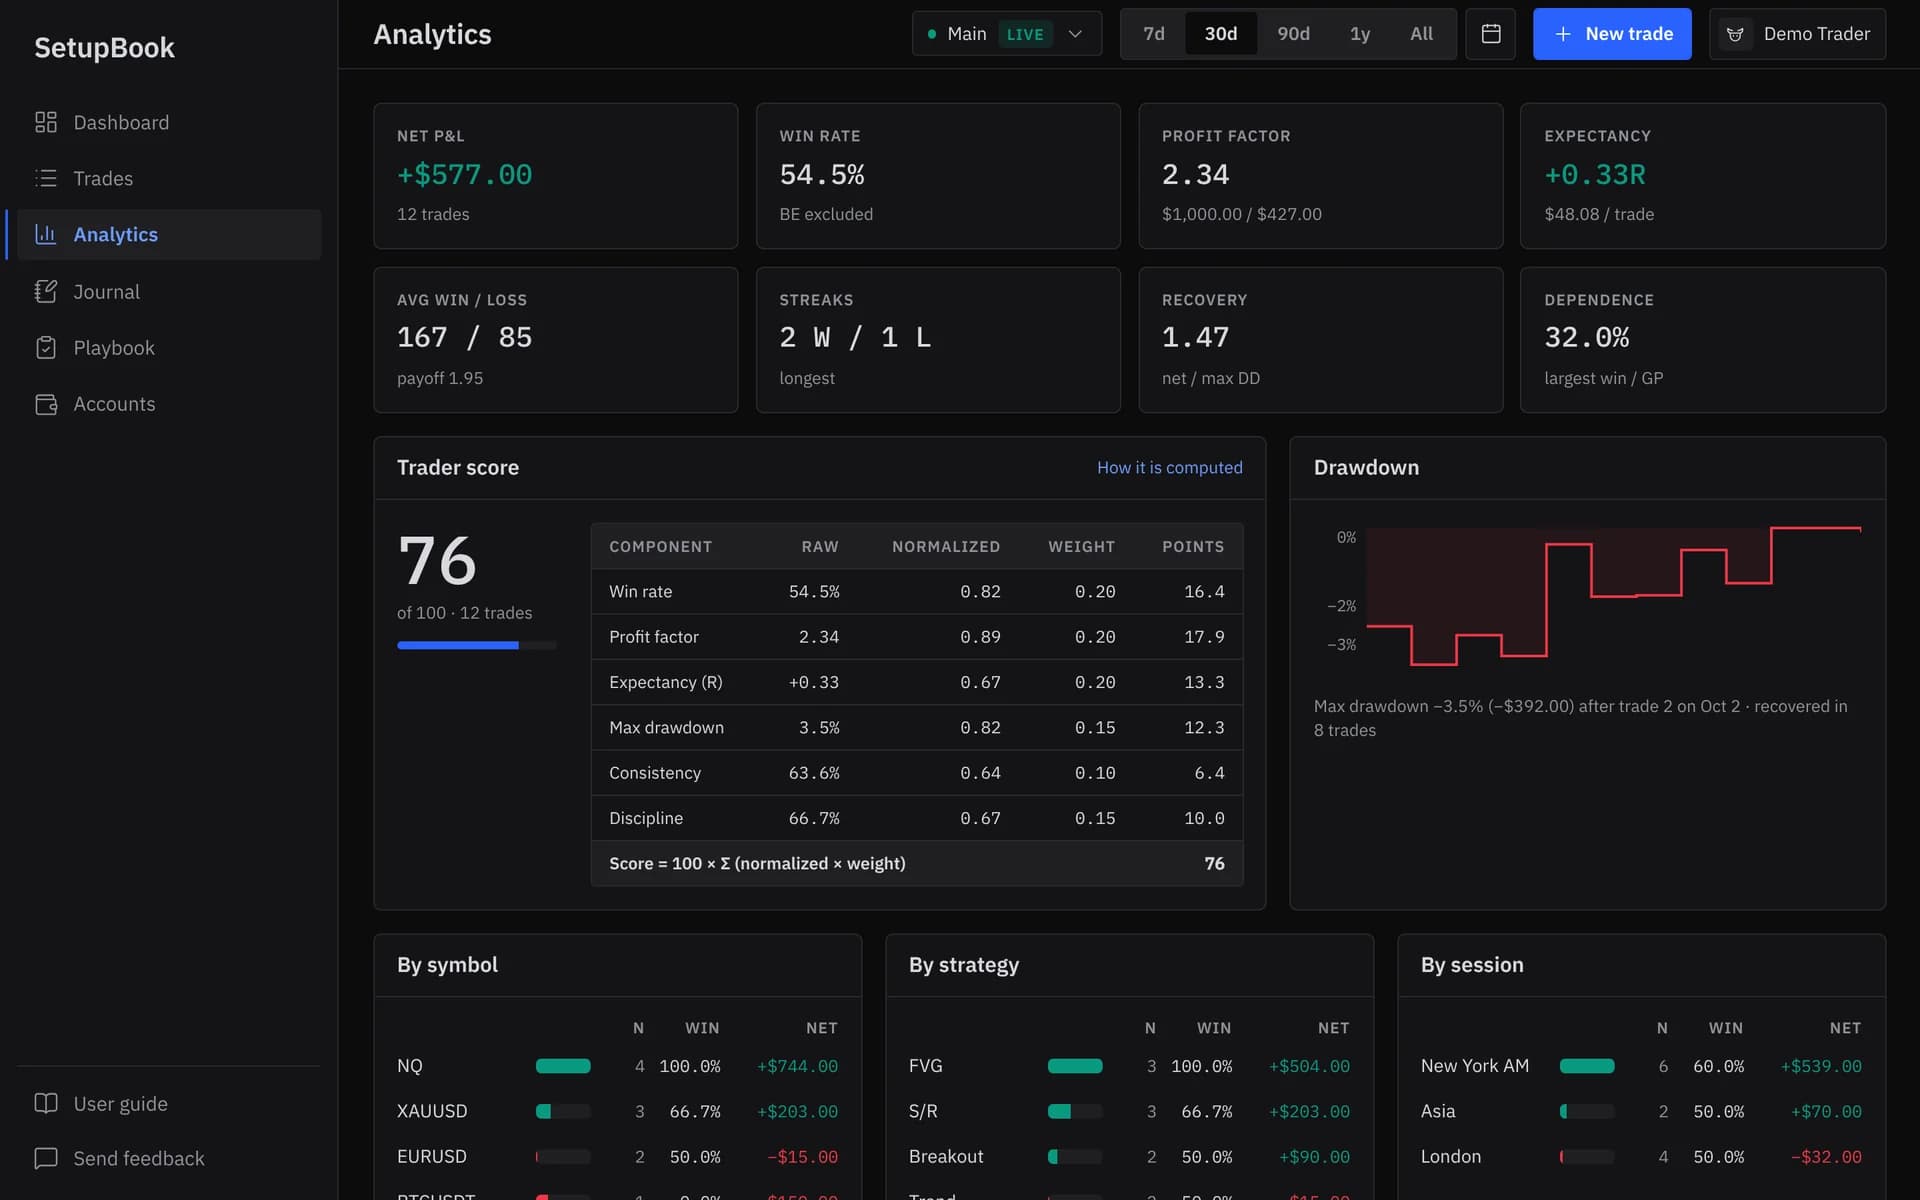
  • Analytics: KPI cards, the trader score of 76 with its formula broken into components, the drawdown chart and breakdowns by symbol, strategy and session
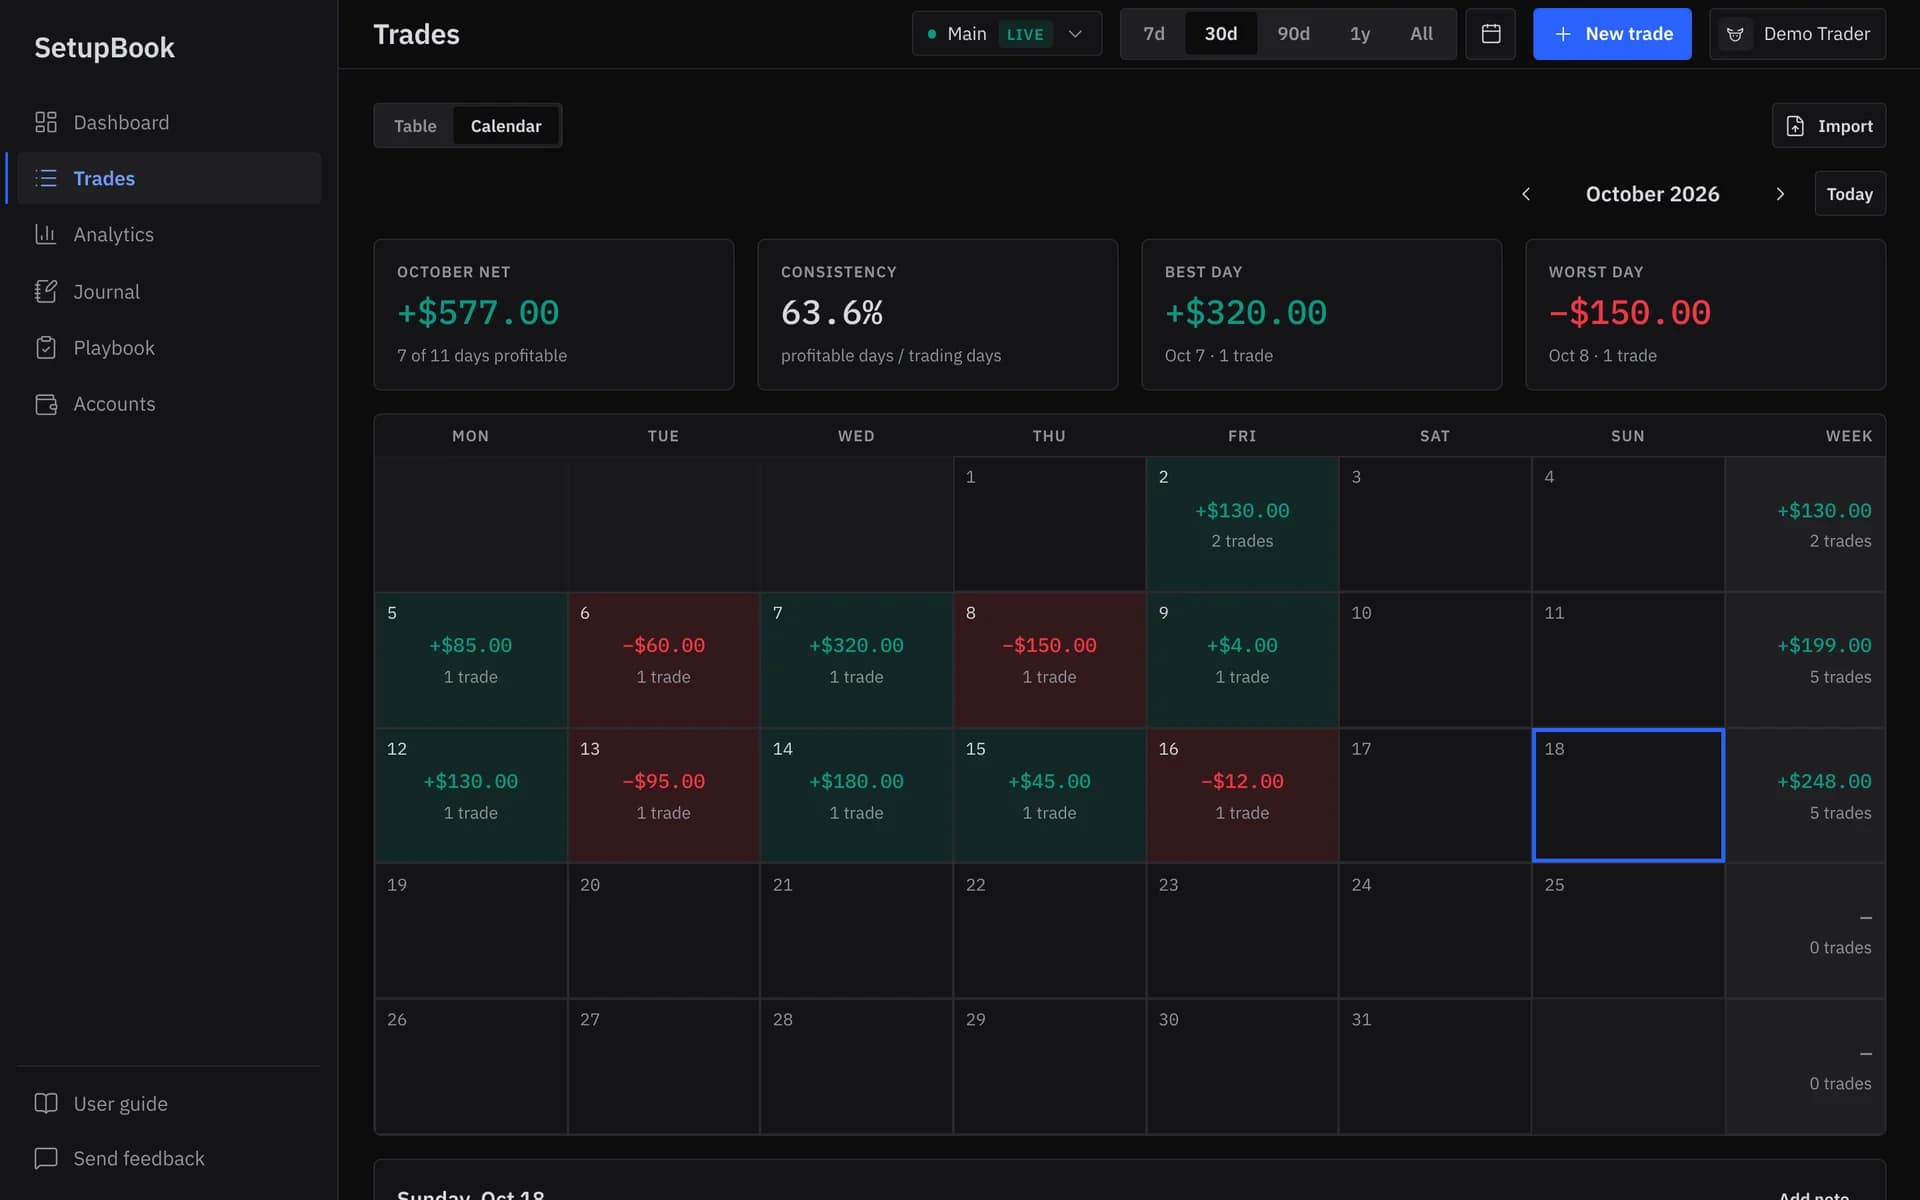
  • The trades calendar for October 2026 with the month's net, consistency, best and worst day, and each day's result and weekly totals
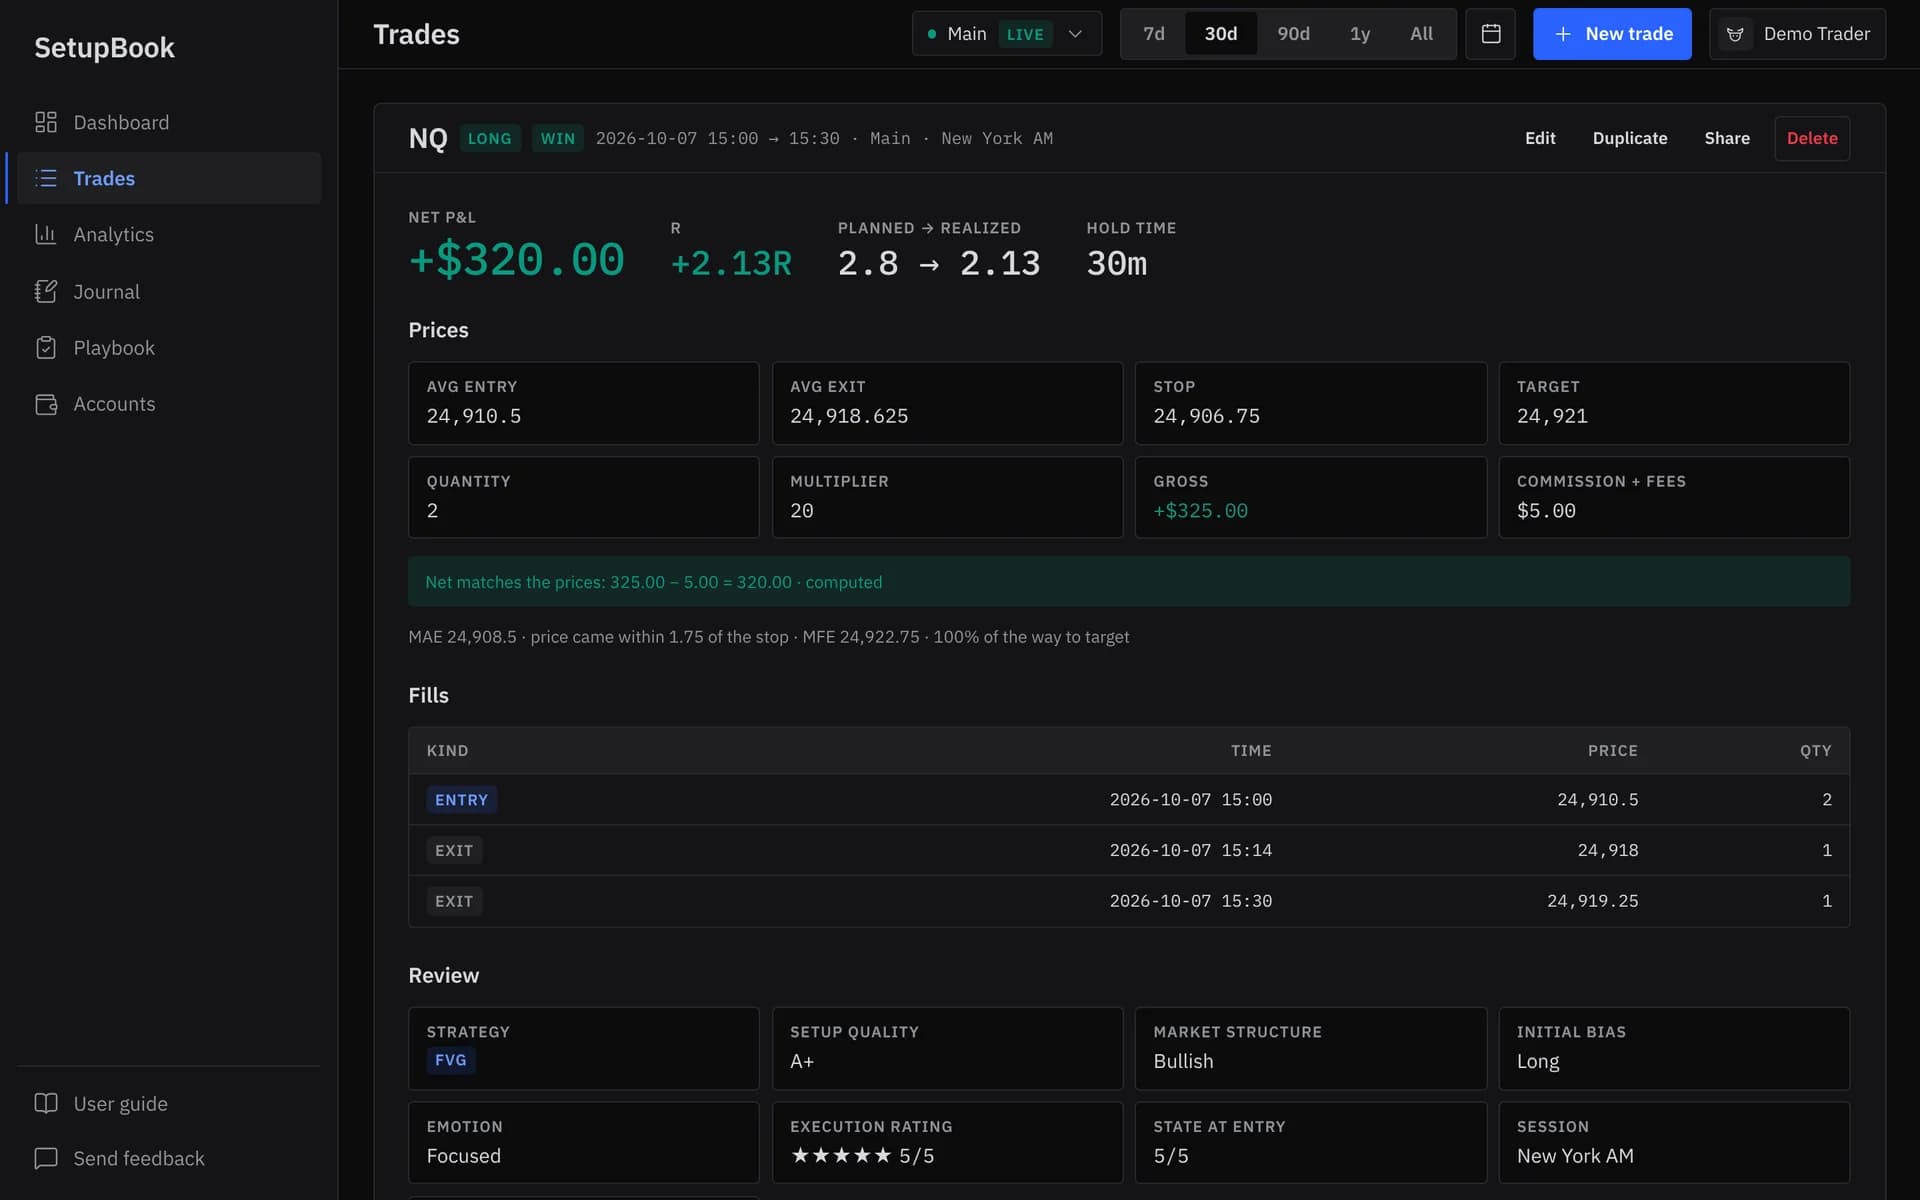
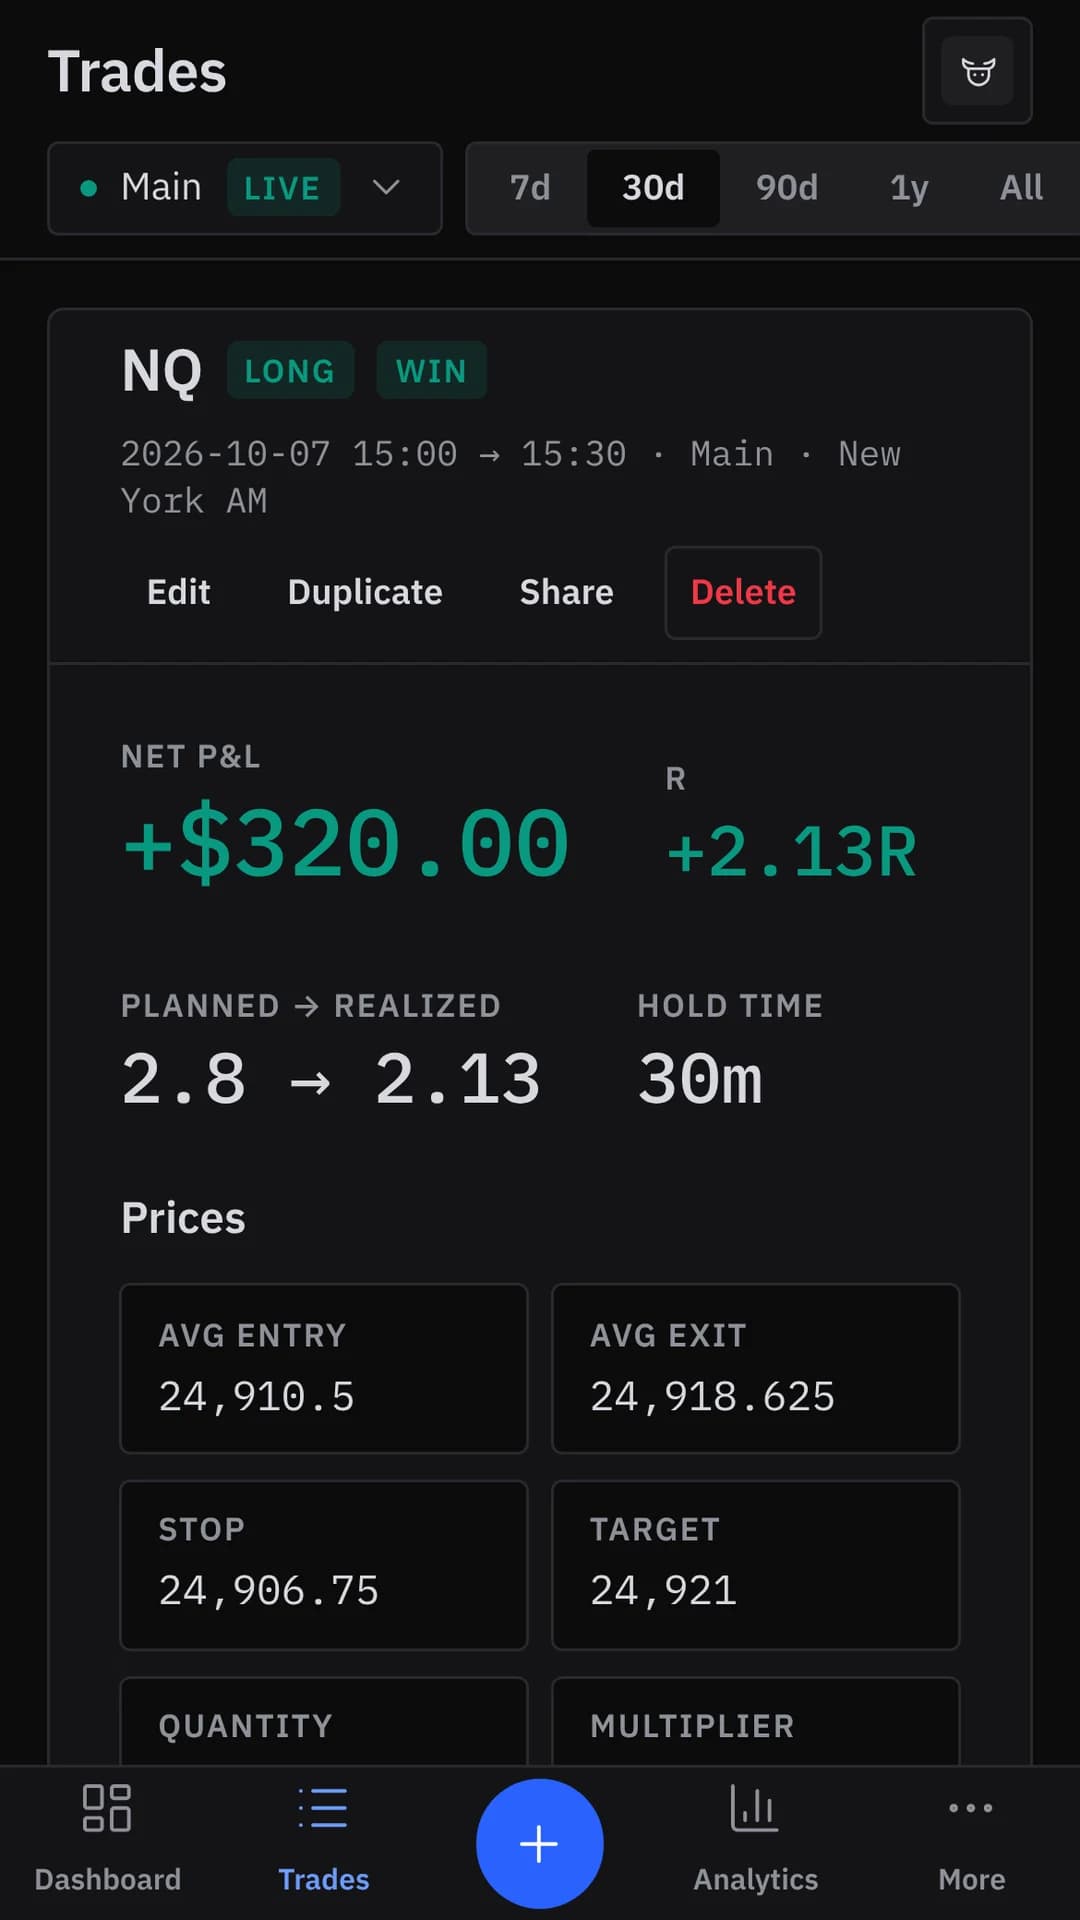
  • A trade's detail: NQ long at +$320.00 and +2.13R with prices, fills, exit analysis from MAE and MFE, and the review
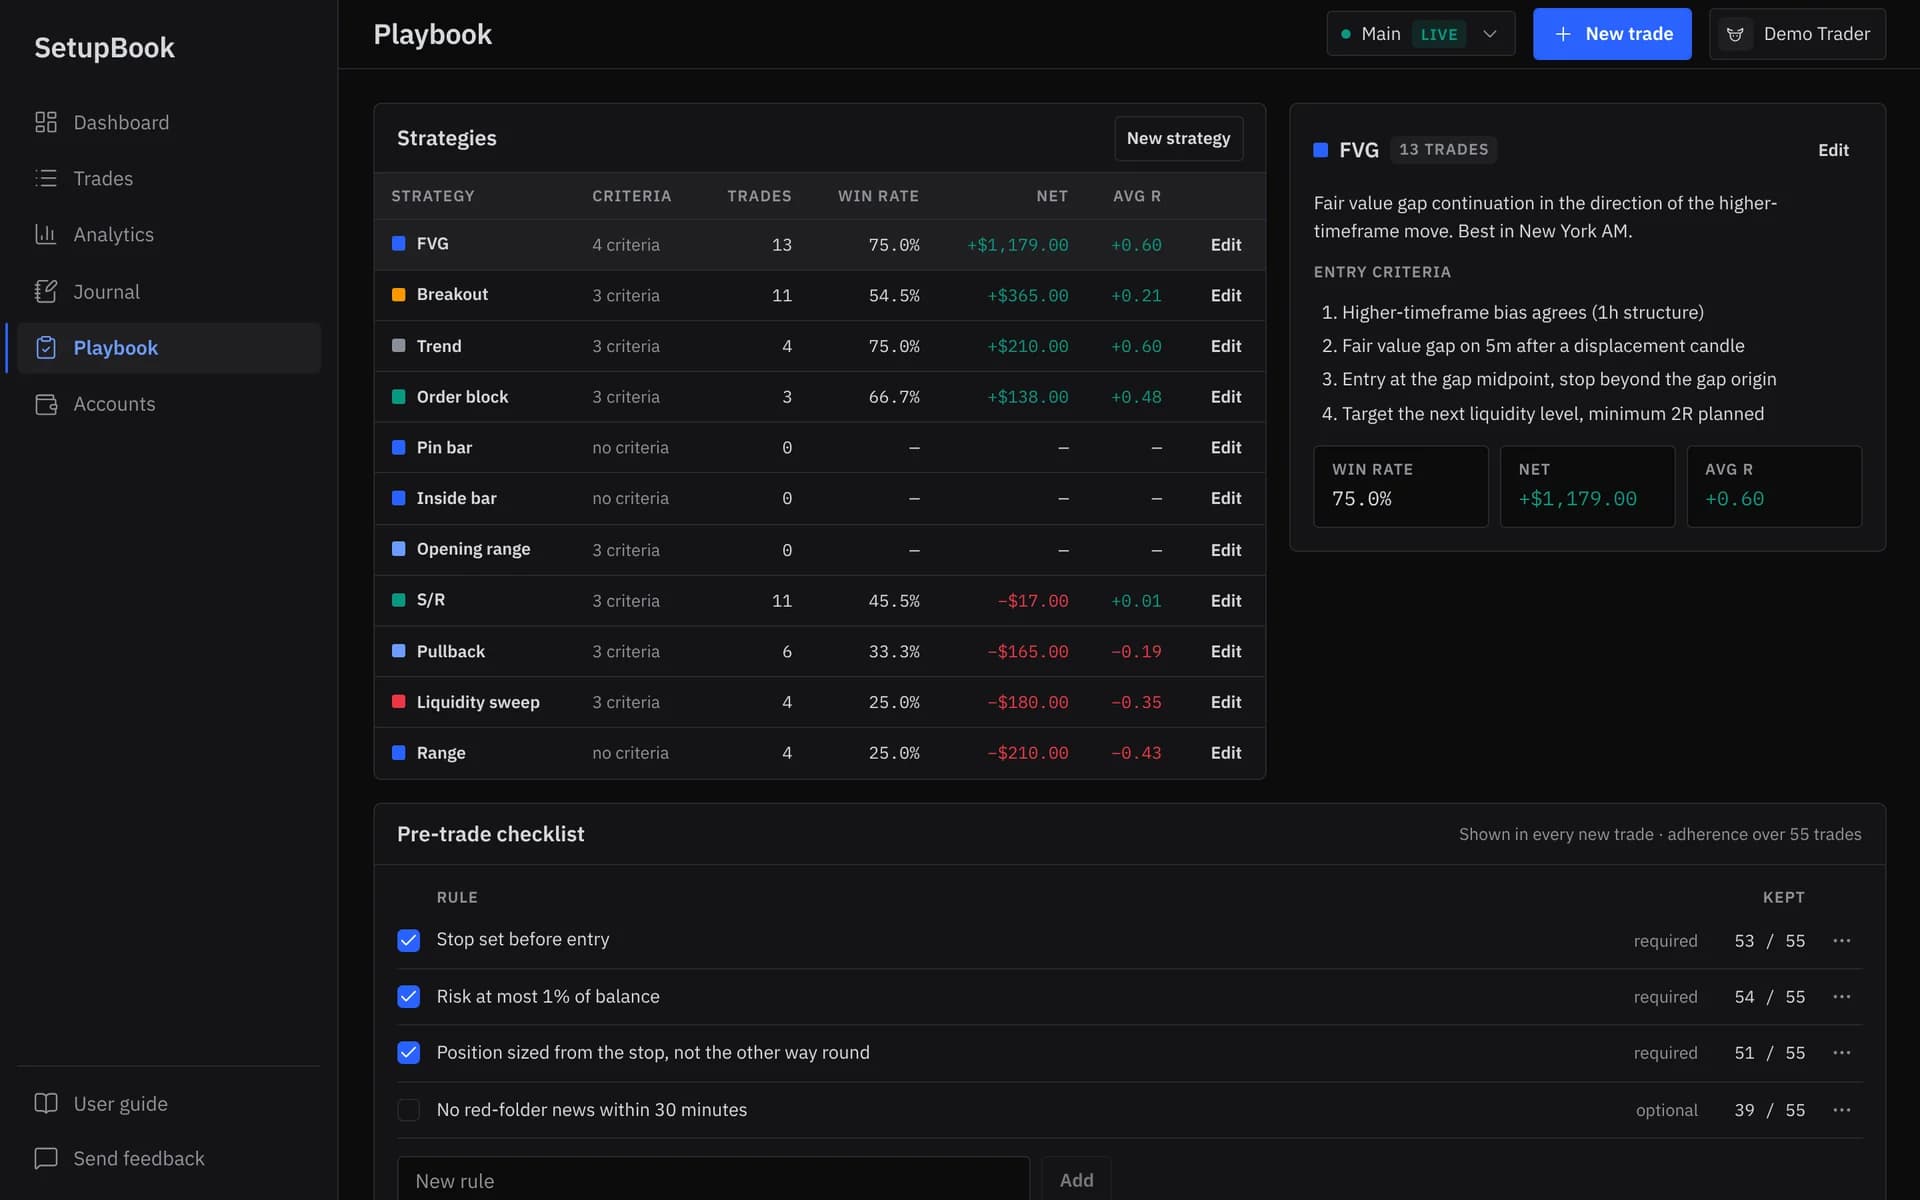
  • The playbook: eleven strategies with criteria, trades, win rate, net and average R, the FVG strategy's entry criteria and the pre-trade checklist with how often each rule was kept
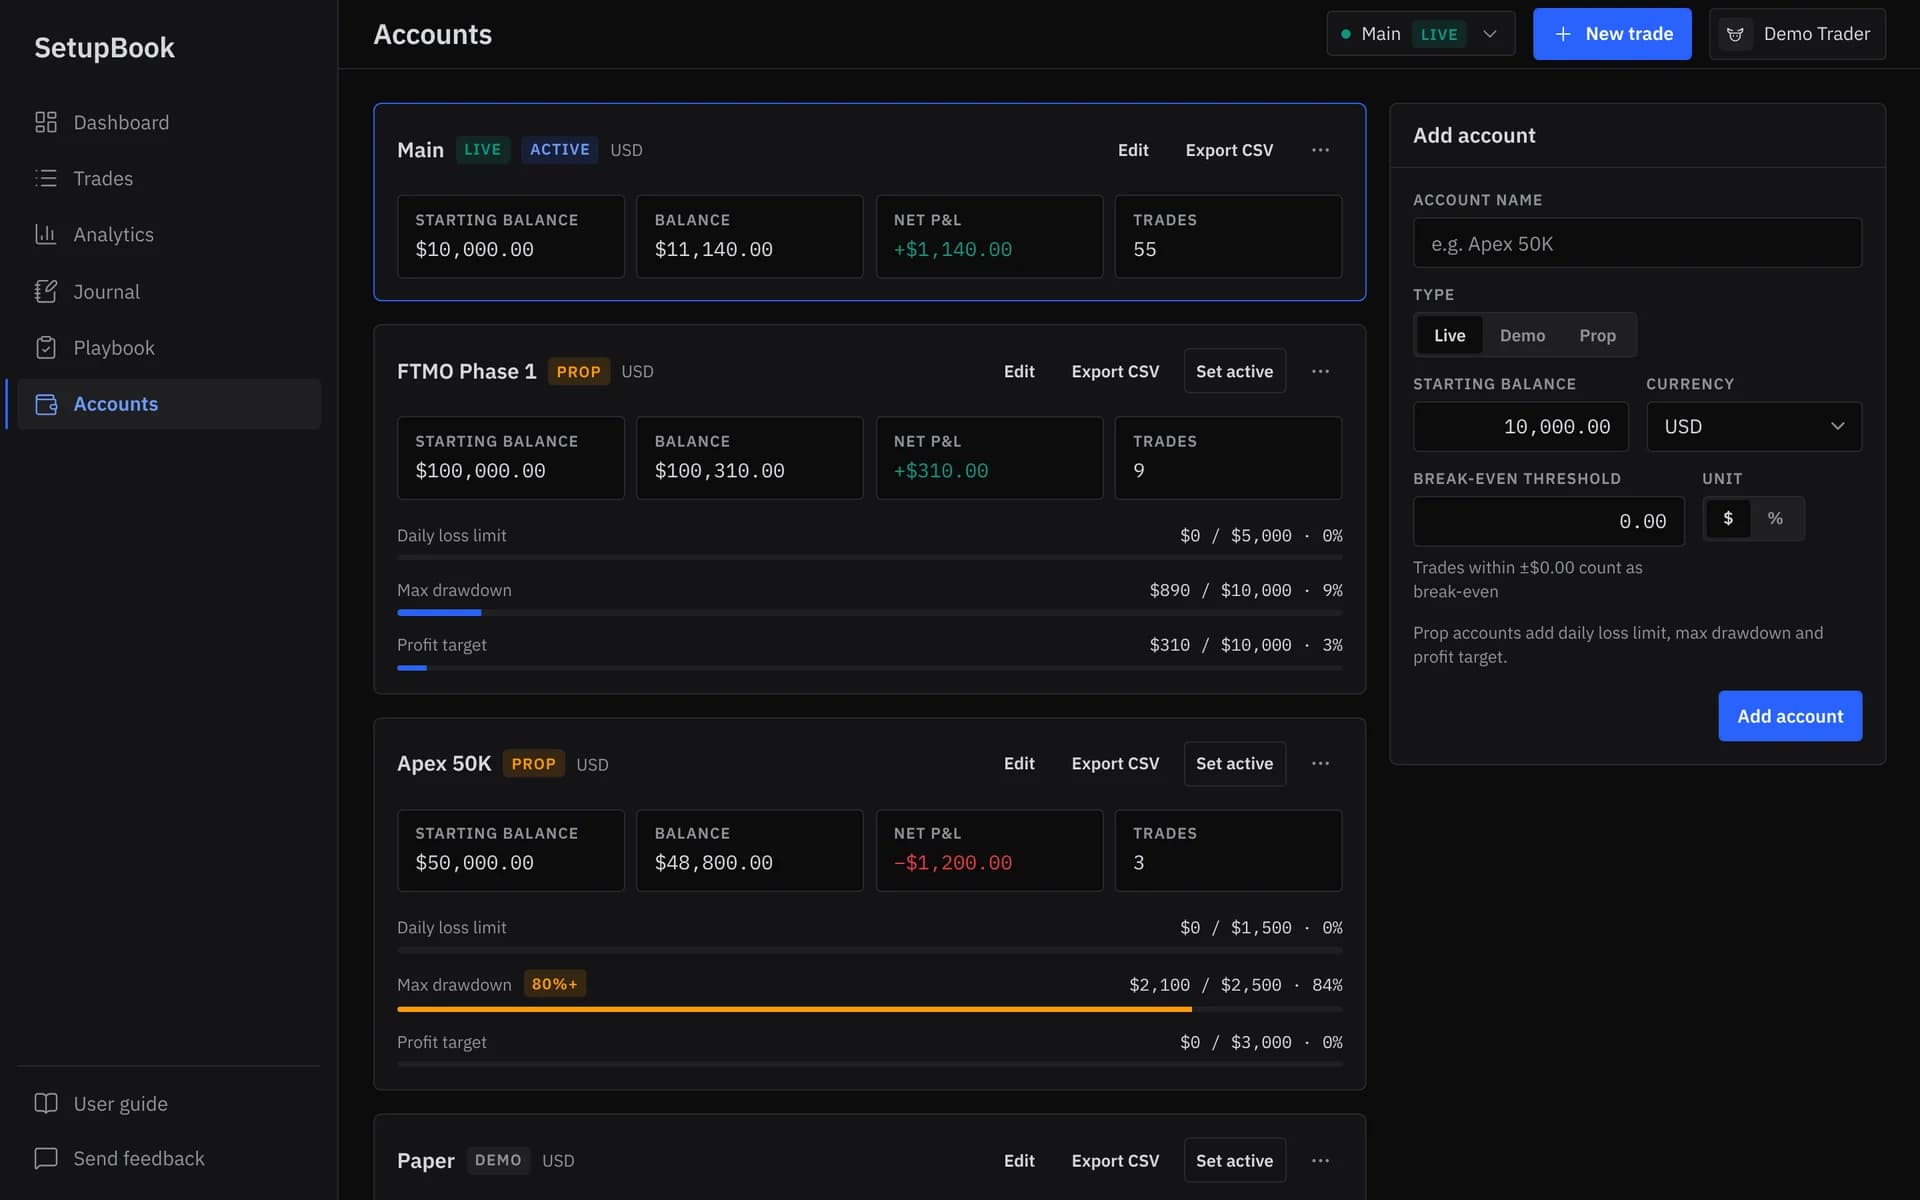
  • Accounts: a live account, two prop-firm accounts with daily loss, max drawdown and profit target bars, and a demo account
08
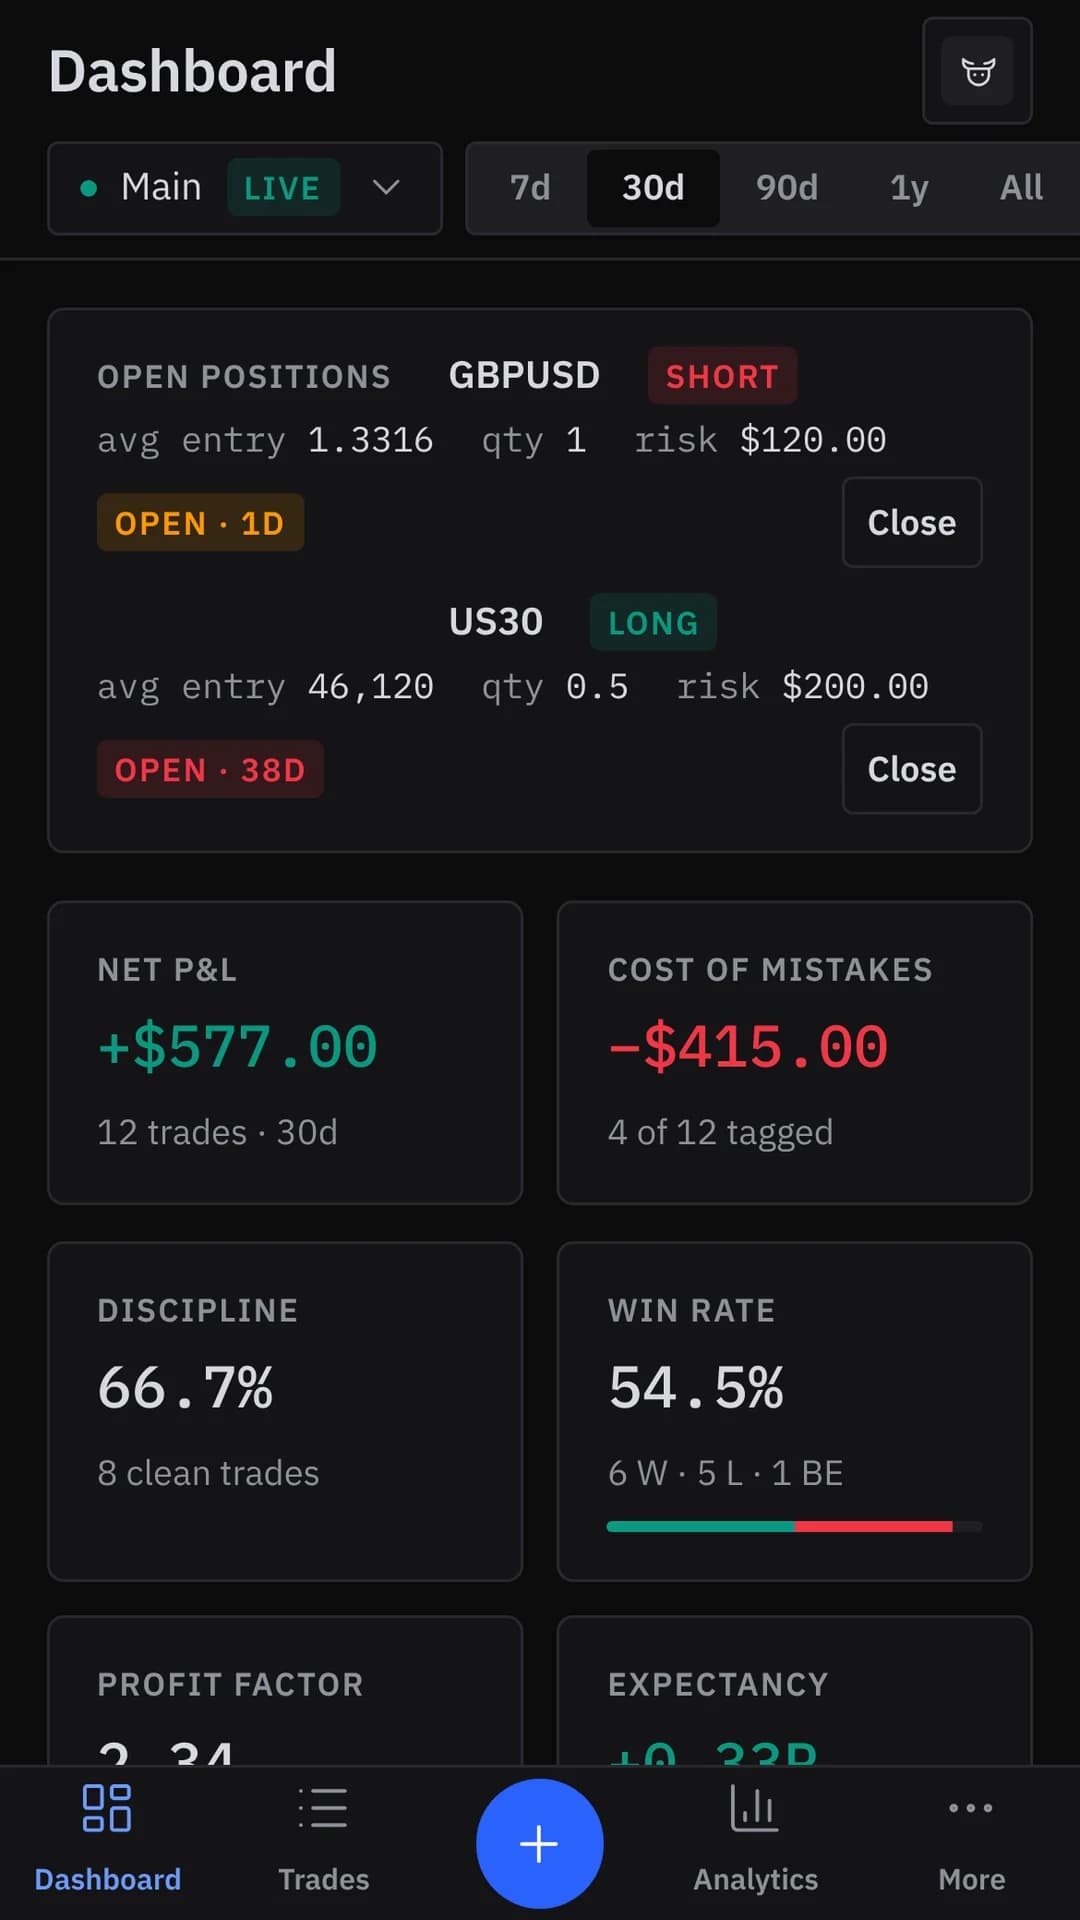
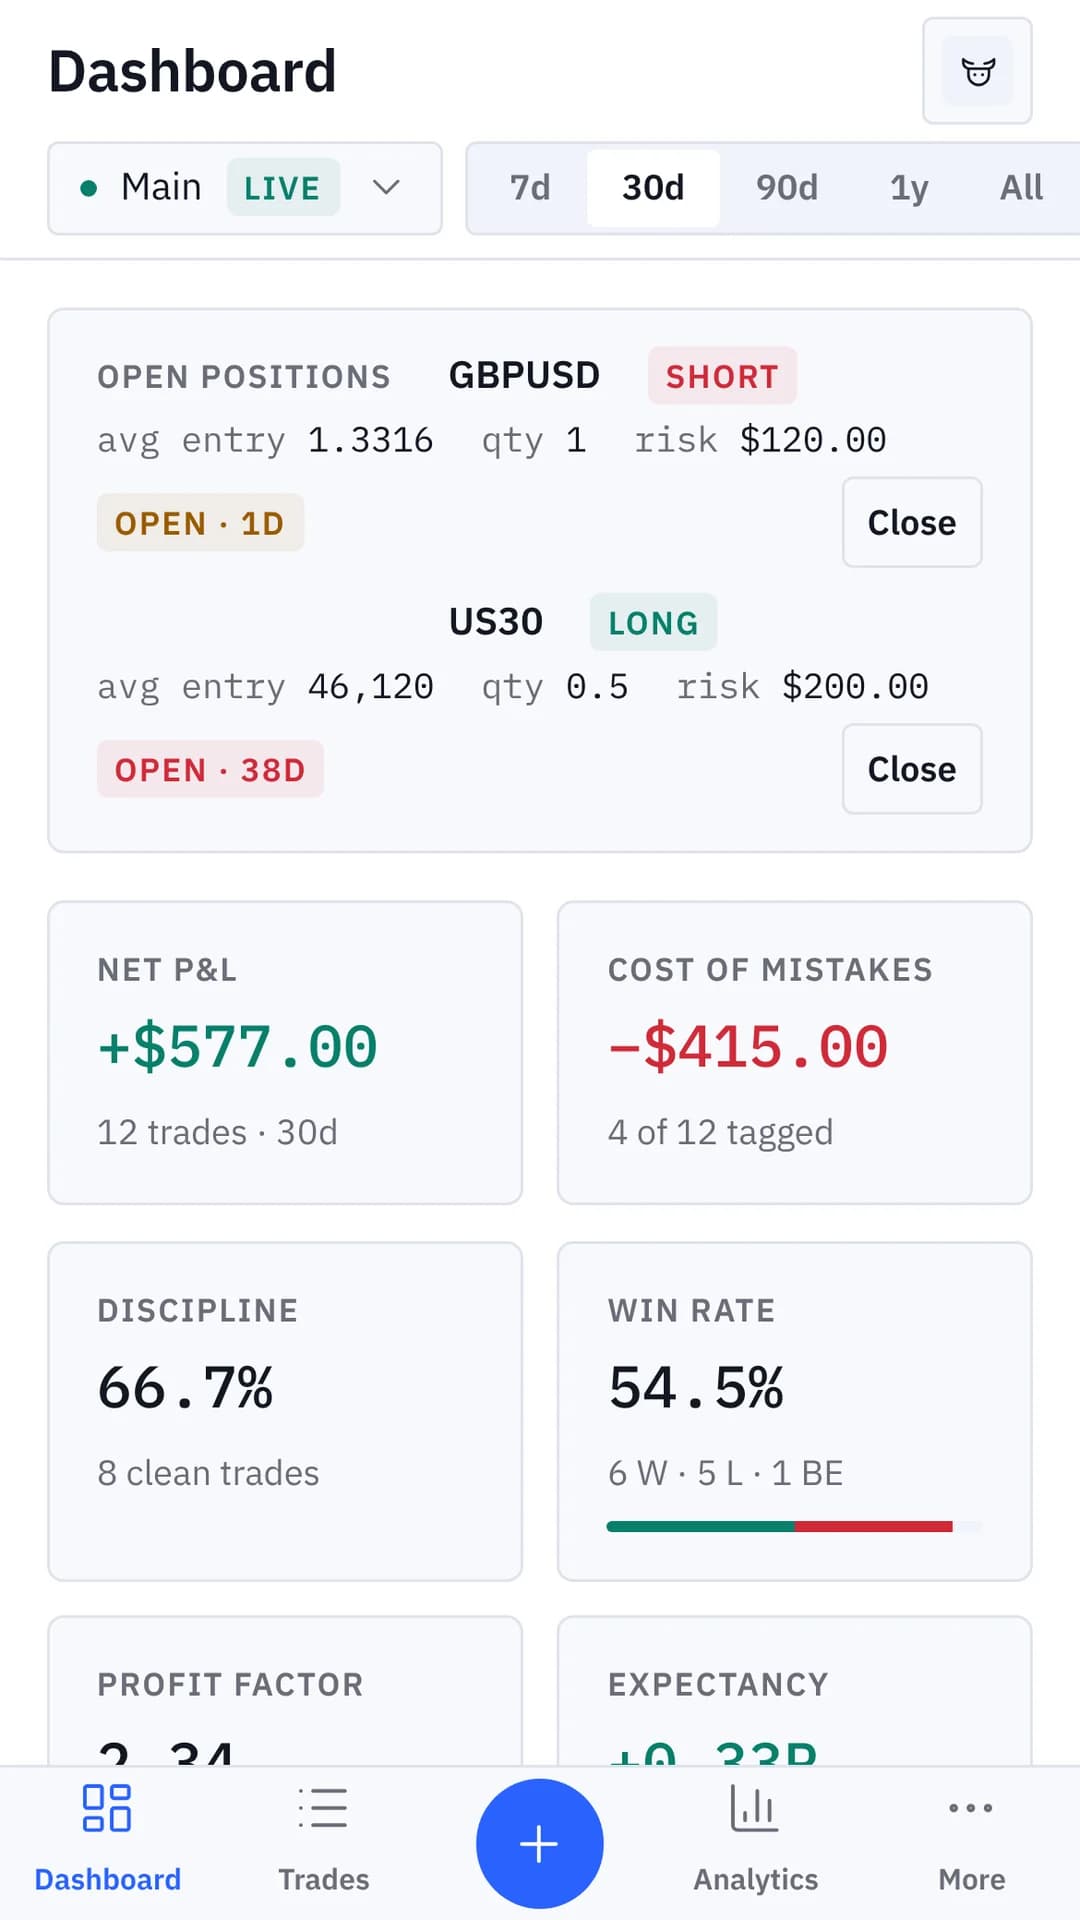
  • The dashboard on a phone: open GBPUSD and US30 positions, net P&L of +$577.00 over 30 days, cost of mistakes −$415.00, discipline 66.7% and a 54.5% win rate
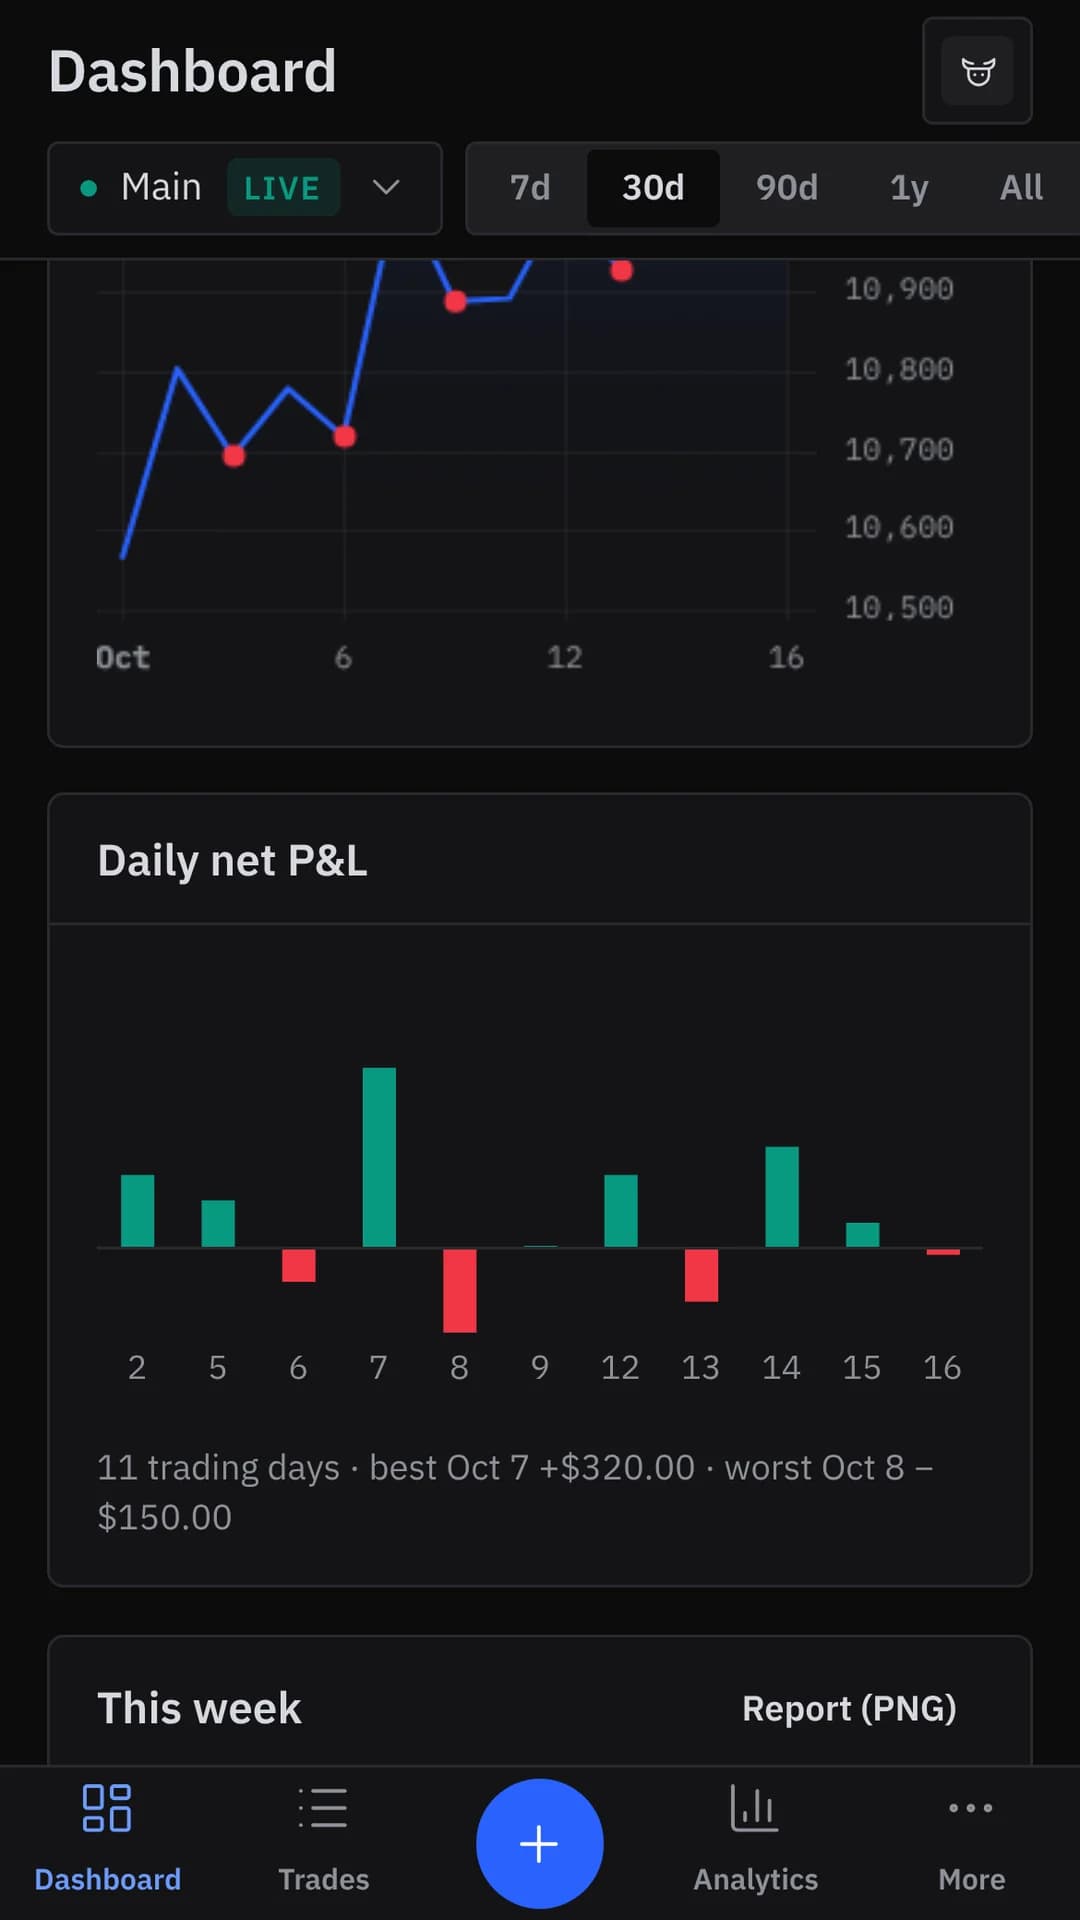
  • Further down the dashboard: the equity curve with losing trades marked in red, and the daily net P&L bars with the best and worst day
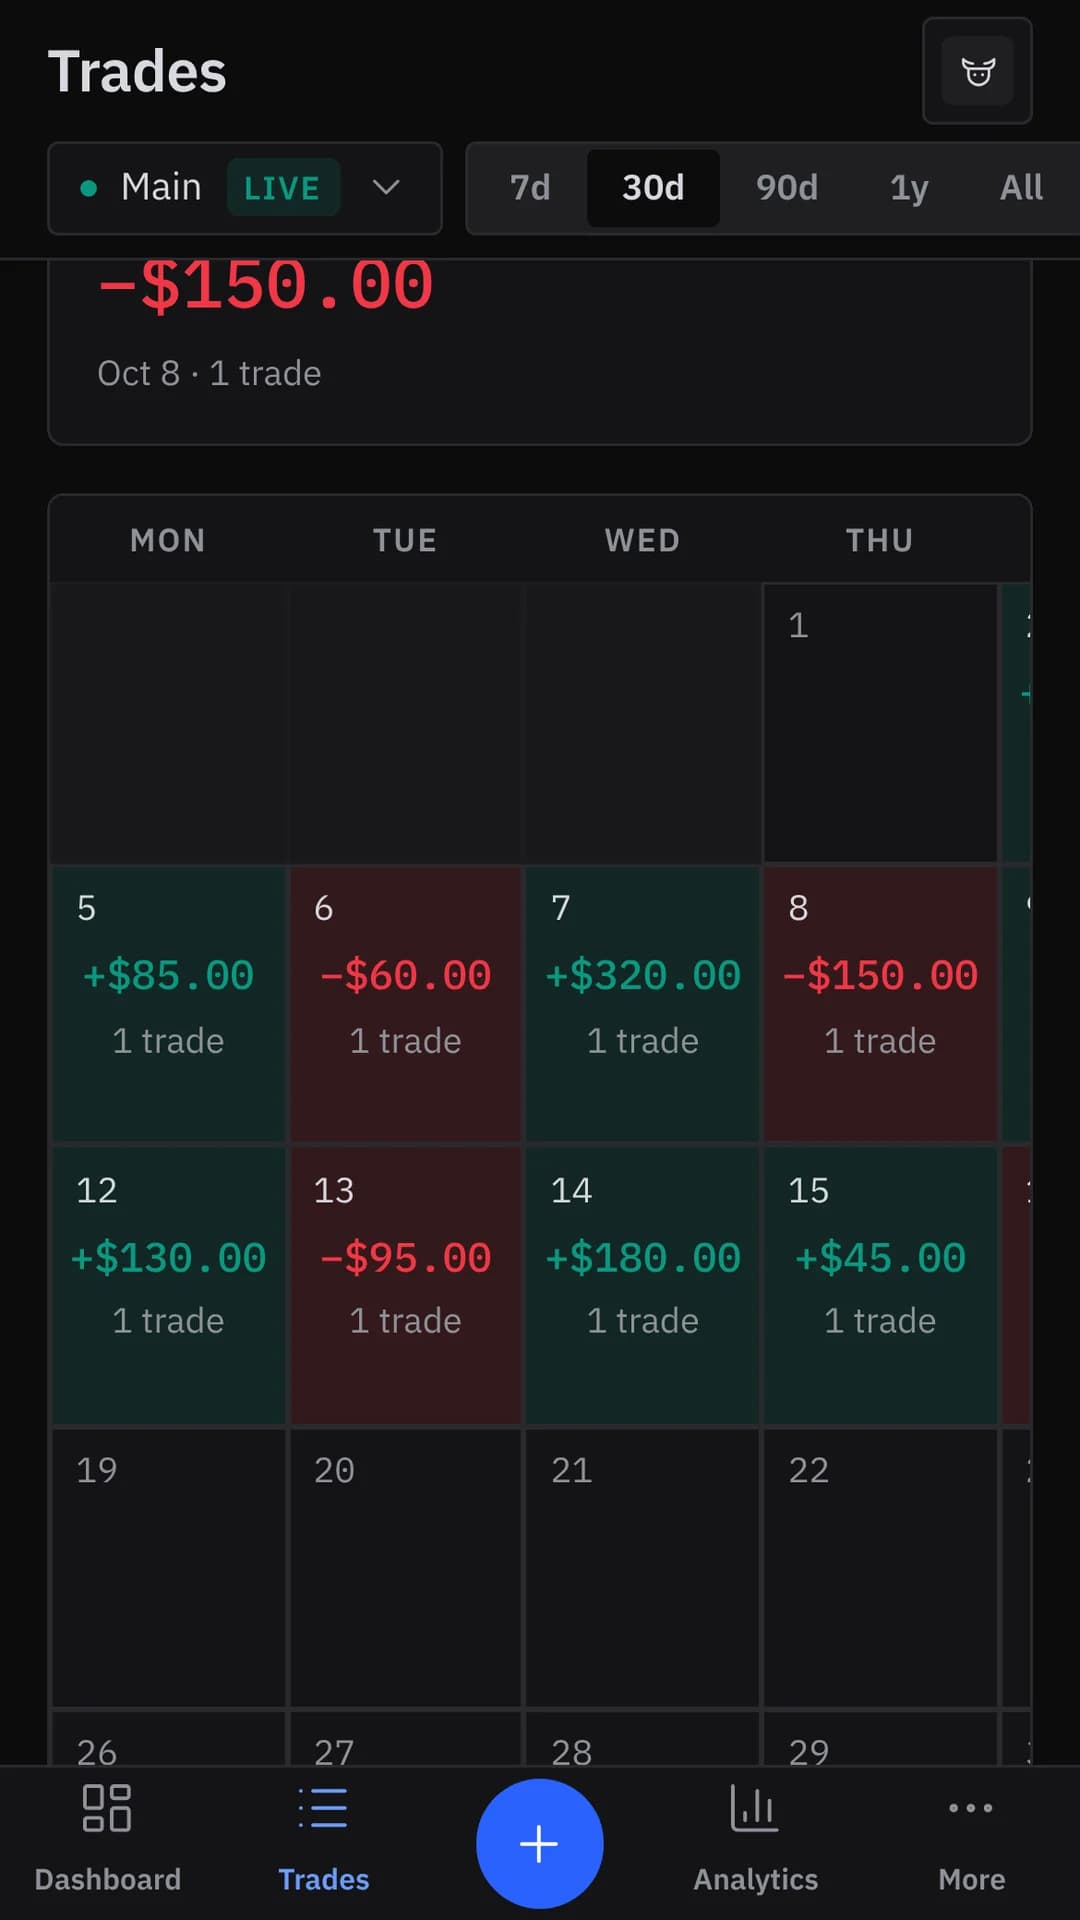
  • The October 2026 trades calendar: each day's net result and trade count, green for profitable days and red for losing ones
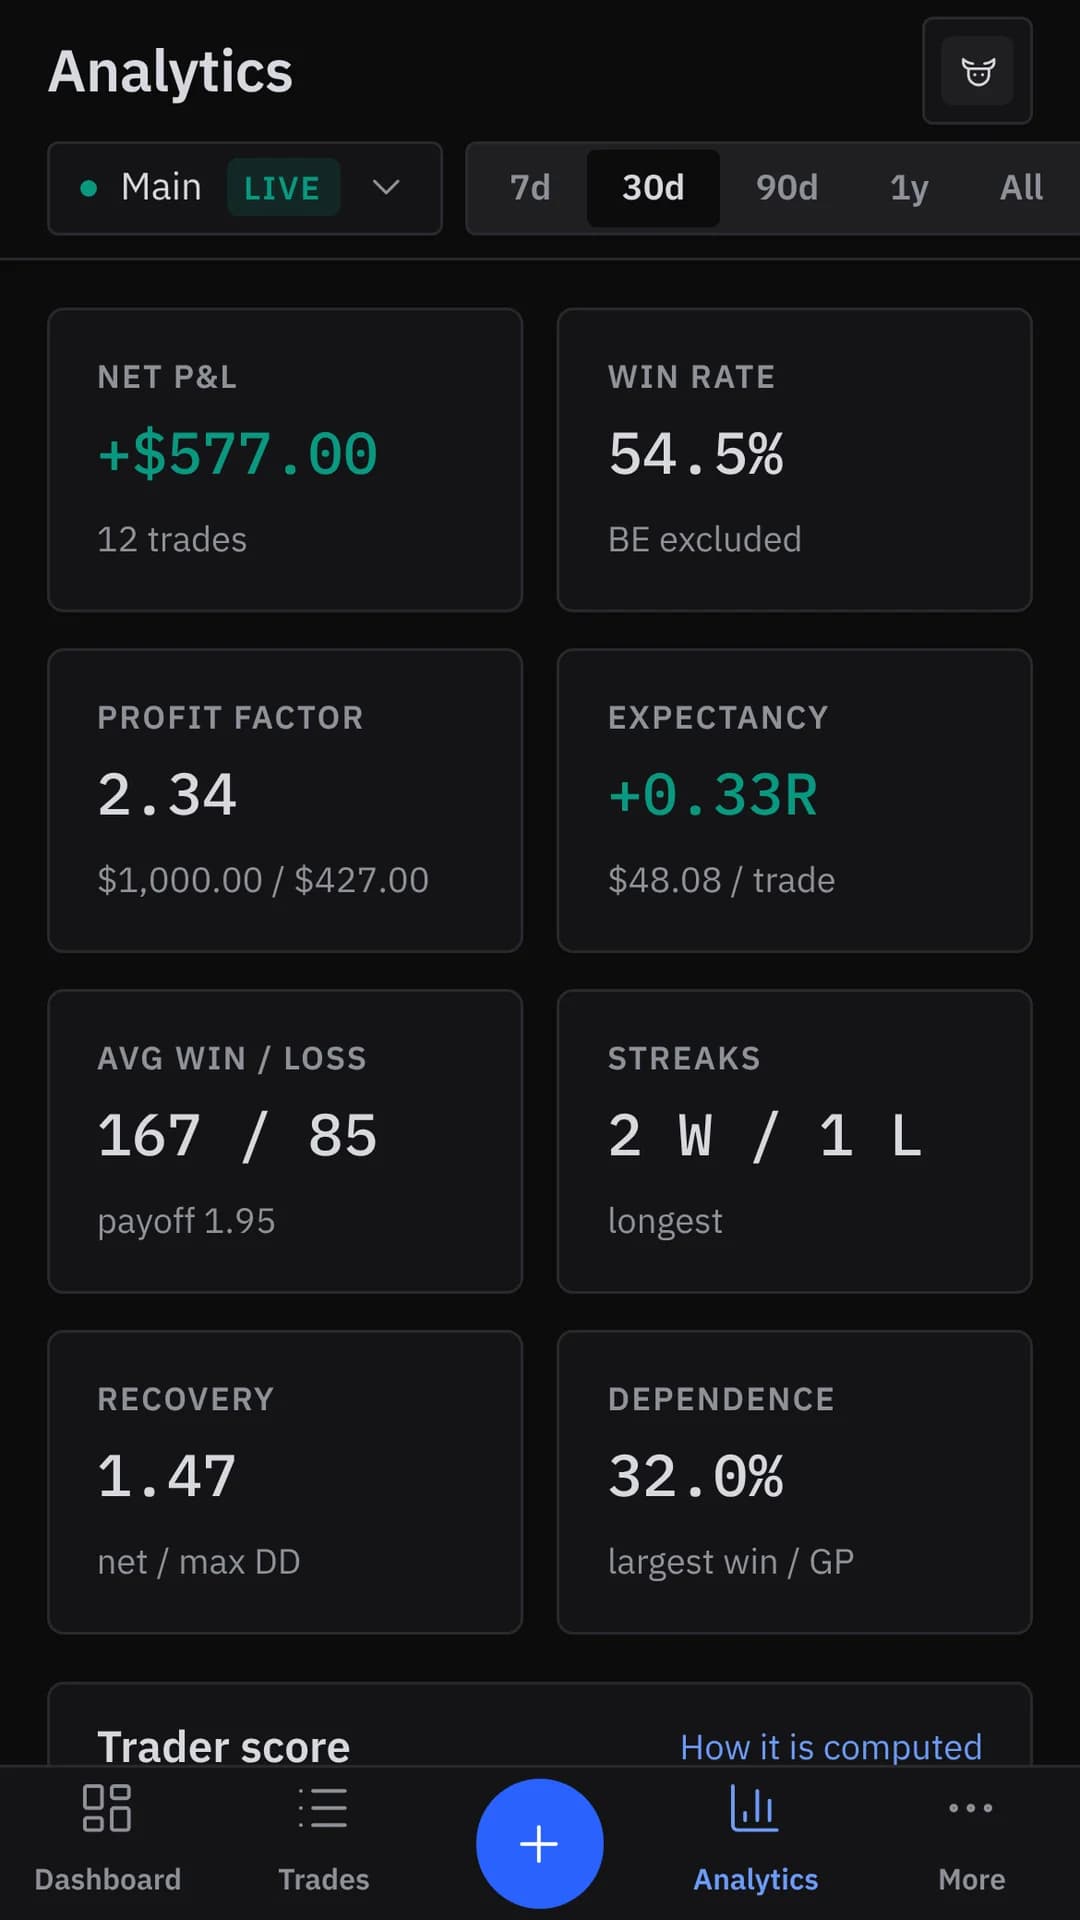
  • Analytics: net P&L, win rate, a profit factor of 2.34, expectancy of +0.33R, average win and loss, streaks, recovery and dependence on the largest win
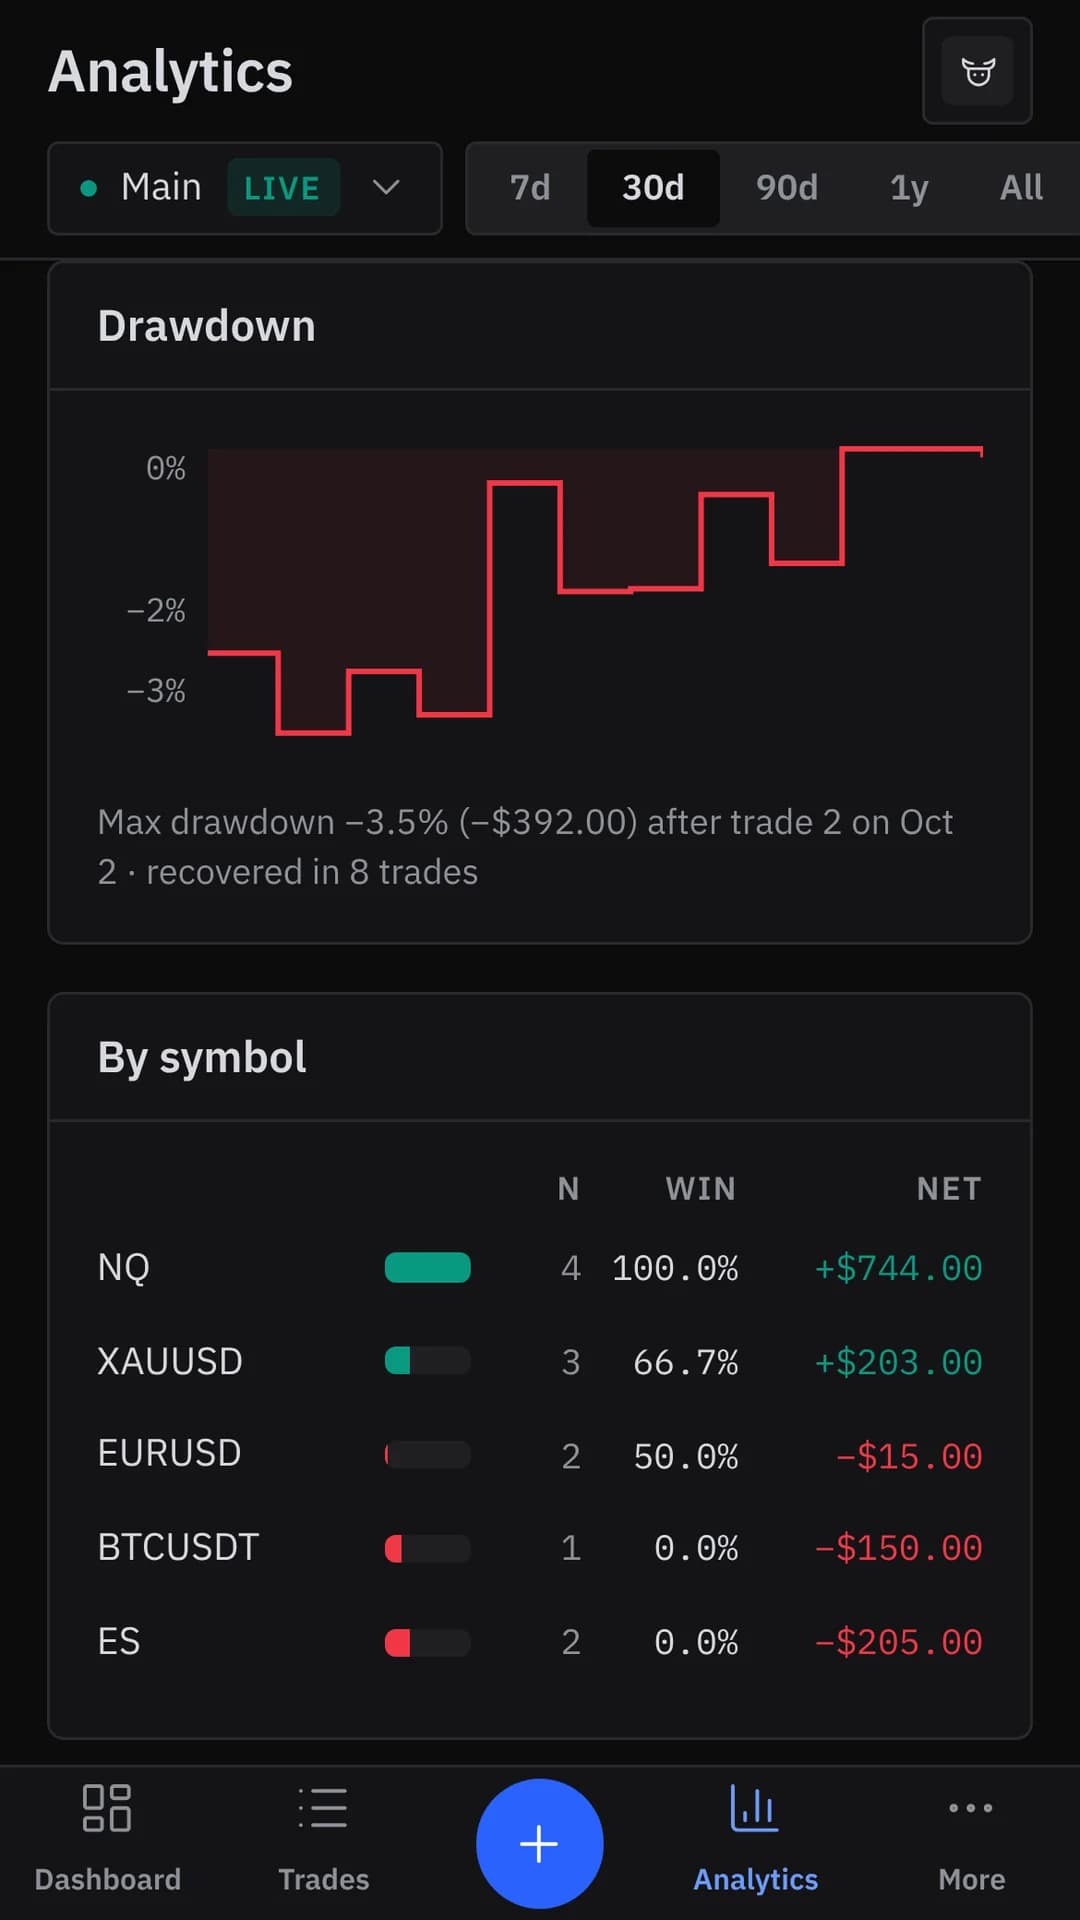
  • Further down analytics: the drawdown chart with its −3.5% low and the results broken down by symbol
  • A trade's detail: NQ long, +$320.00 and +2.13R, 2.8R planned against 2.13R realized, a 30-minute hold and the entry, exit, stop and target prices
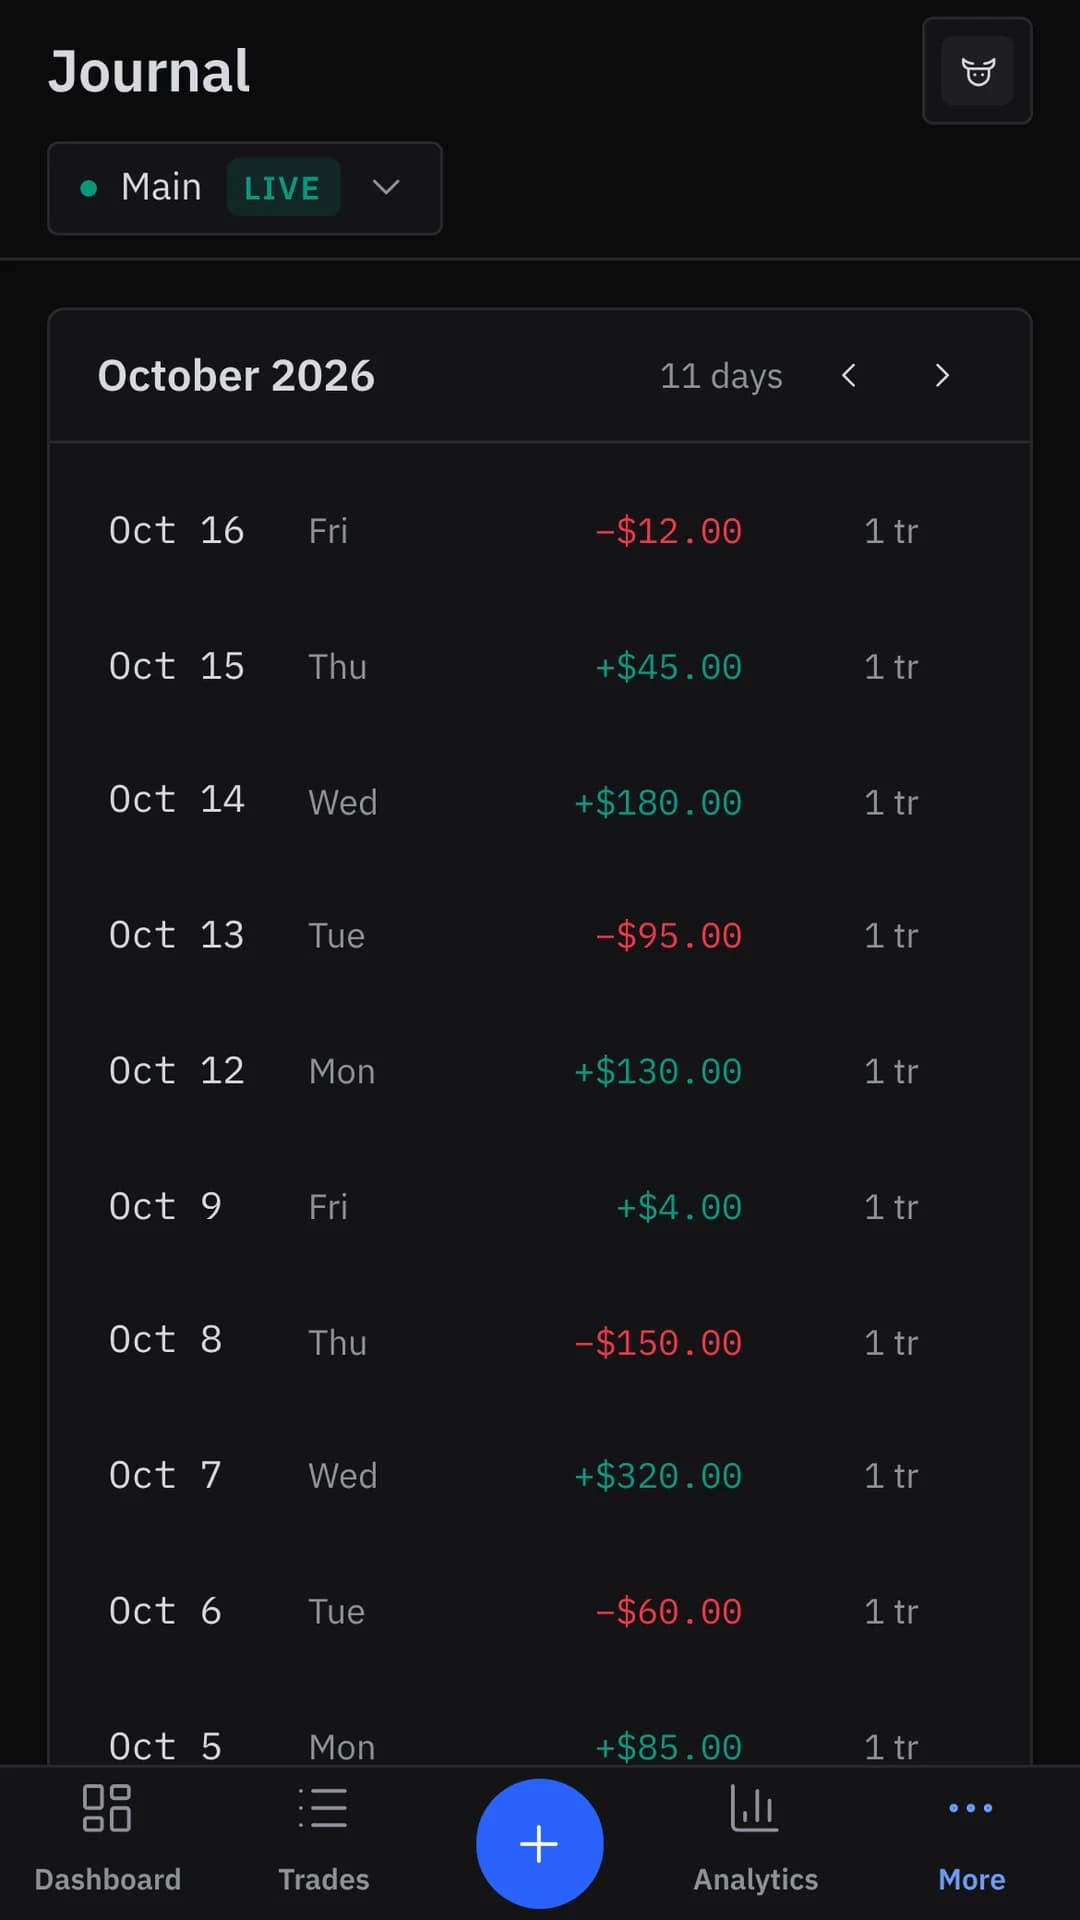
  • The journal: the trading days of October with each day's net P&L and number of trades
  • The dashboard in the light theme: open positions, net P&L, cost of mistakes, discipline and win rate
WHAT WE DID HERESEE THE SERVICES
NEXT PROJECT / 01VOCABULARY
HAVE A PROJECT LIKE THIS?START A PROJECT